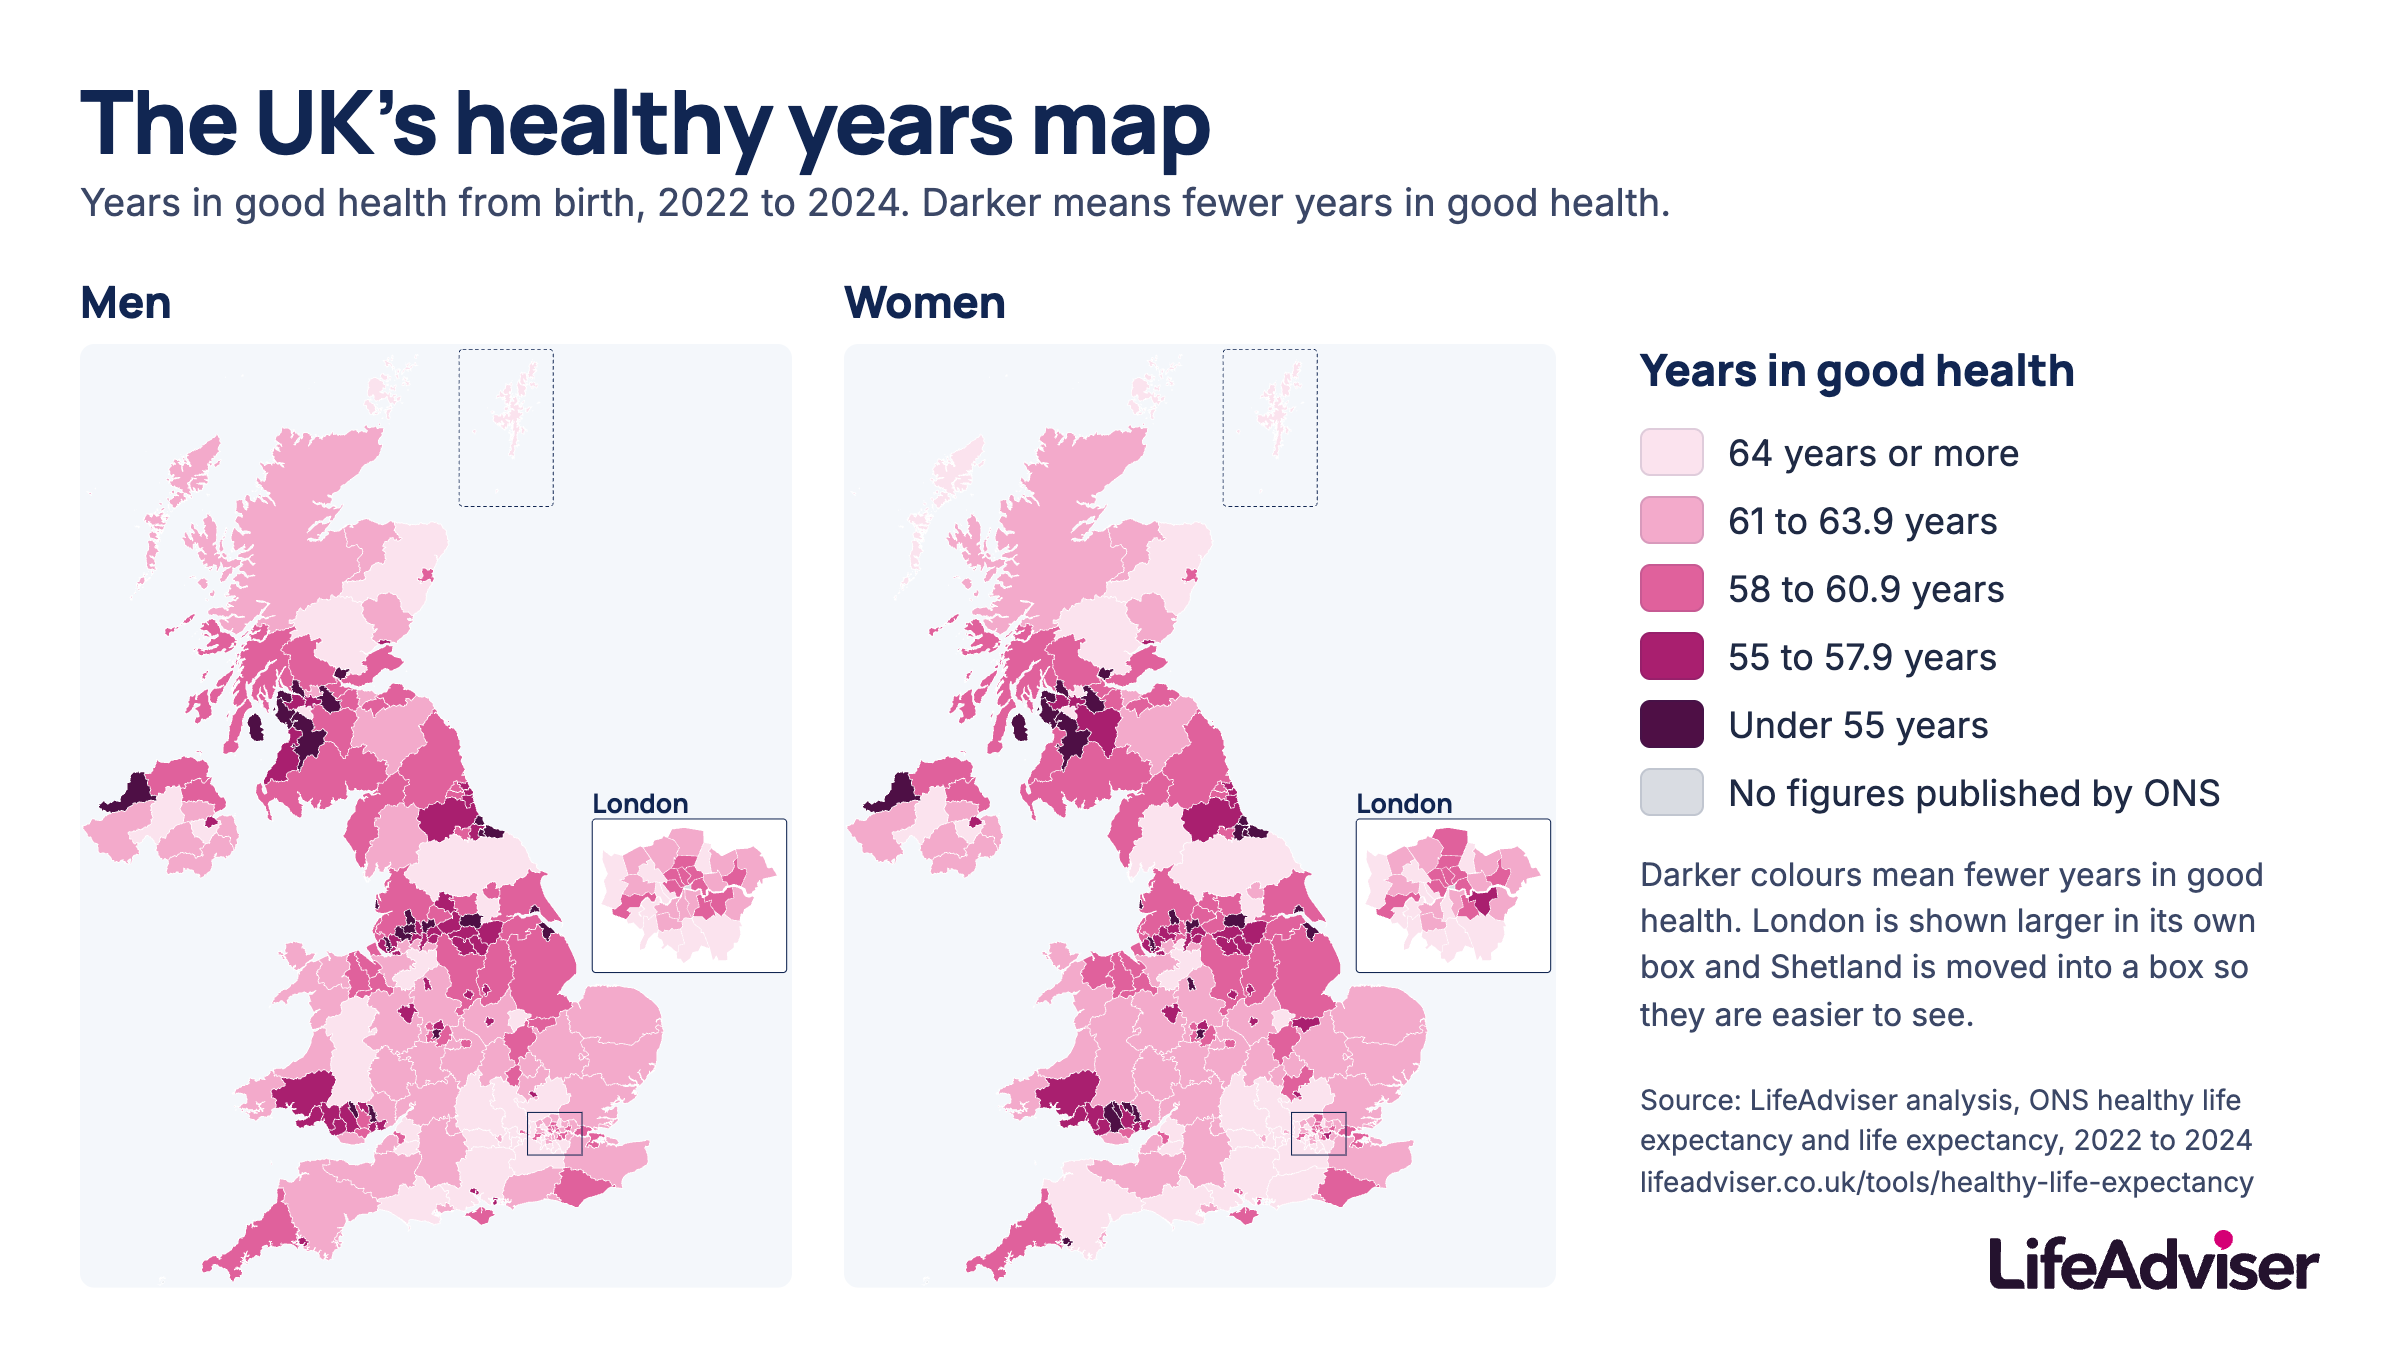
How many years in good health in your area?
Pick man or woman, then enter where you live to see your area’s figures.
Nothing you type leaves your device.
60.7 years in good health for UK men
60.9 years in good health for UK women
Years in good health
- 64 years or more
- 61 to 63.9 years
- 58 to 60.9 years
- 55 to 57.9 years
- Under 55 years
- No figures
10 areas with the most years in good health
Men
| Area | Years in good health | Years in poor health |
|---|---|---|
| Richmond upon ThamesLondon | 69.365.2 to 73.5 years range | 13.482.7 years life expectancy |
| SuttonLondon | 68.364.4 to 72.2 years range | 12.680.9 years life expectancy |
| WokinghamSouth East | 68.065.1 to 71.0 years range | 14.882.8 years life expectancy |
| East RenfrewshireScotland | 67.964.0 to 71.8 years range | 13.681.5 years life expectancy |
| BromleyLondon | 67.564.4 to 70.6 years range | 14.481.9 years life expectancy |
| Windsor and MaidenheadSouth East | 67.364.8 to 69.8 years range | 14.581.8 years life expectancy |
| Kingston upon ThamesLondon | 66.962.3 to 71.4 years range | 15.182.0 years life expectancy |
| CroydonLondon | 66.763.0 to 70.3 years range | 13.279.9 years life expectancy |
| Kensington and ChelseaLondon | 66.562.2 to 70.8 years range | 15.782.2 years life expectancy |
| Hammersmith and FulhamLondon | 66.261.5 to 71.0 years range | 13.880.0 years life expectancy |
Women
| Area | Years in good health | Years in poor health |
|---|---|---|
| Richmond upon ThamesLondon | 70.365.2 to 75.4 years range | 16.586.8 years life expectancy |
| WokinghamSouth East | 69.466.0 to 72.9 years range | 16.485.8 years life expectancy |
| Windsor and MaidenheadSouth East | 68.965.4 to 72.4 years range | 16.585.4 years life expectancy |
| East RenfrewshireScotland | 68.764.3 to 73.0 years range | 16.284.9 years life expectancy |
| SuttonLondon | 68.764.5 to 72.9 years range | 15.884.5 years life expectancy |
| BromleyLondon | 67.764.0 to 71.4 years range | 18.085.7 years life expectancy |
| CroydonLondon | 67.563.8 to 71.1 years range | 16.884.3 years life expectancy |
| Hammersmith and FulhamLondon | 67.161.7 to 72.5 years range | 17.584.6 years life expectancy |
| Bracknell ForestSouth East | 67.063.6 to 70.4 years range | 18.285.2 years life expectancy |
| Kingston upon ThamesLondon | 67.062.1 to 71.9 years range | 18.485.4 years life expectancy |
10 areas with the fewest years in good health
18.4 years in good health separate men in Richmond upon Thames and Blackpool.
Men
| Area | Years in good health | Years in poor health |
|---|---|---|
| BlackpoolNorth West | 50.947.3 to 54.4 years range | 22.873.7 years life expectancy |
| Merthyr TydfilWales | 51.747.1 to 56.3 years range | 23.375.0 years life expectancy |
| HartlepoolNorth East | 52.148.5 to 55.7 years range | 25.277.3 years life expectancy |
| SandwellWest Midlands | 52.748.7 to 56.8 years range | 24.076.7 years life expectancy |
| North LanarkshireScotland | 52.948.5 to 57.2 years range | 22.375.2 years life expectancy |
| City of Kingston upon HullYorkshire and the Humber | 53.148.5 to 57.7 years range | 22.475.5 years life expectancy |
| West DunbartonshireScotland | 53.249.5 to 56.9 years range | 21.875.0 years life expectancy |
| North AyrshireScotland | 53.348.5 to 58.0 years range | 21.775.0 years life expectancy |
| RochdaleNorth West | 53.850.1 to 57.5 years range | 23.577.3 years life expectancy |
| MiddlesbroughNorth East | 53.950.6 to 57.2 years range | 21.675.5 years life expectancy |
Women
| Area | Years in good health | Years in poor health |
|---|---|---|
| Merthyr TydfilWales | 50.144.7 to 55.4 years range | 29.679.7 years life expectancy |
| HartlepoolNorth East | 51.247.1 to 55.2 years range | 29.180.3 years life expectancy |
| SandwellWest Midlands | 51.346.6 to 55.9 years range | 29.981.2 years life expectancy |
| BlackpoolNorth West | 51.847.4 to 56.1 years range | 27.379.1 years life expectancy |
| North LanarkshireScotland | 52.348.0 to 56.5 years range | 26.678.9 years life expectancy |
| TorfaenWales | 52.848.4 to 57.3 years range | 28.881.6 years life expectancy |
| West DunbartonshireScotland | 53.048.6 to 57.3 years range | 26.779.7 years life expectancy |
| City of Kingston upon HullYorkshire and the Humber | 53.349.2 to 57.5 years range | 27.180.4 years life expectancy |
| East AyrshireScotland | 53.548.1 to 58.9 years range | 25.478.9 years life expectancy |
| North AyrshireScotland | 53.548.1 to 58.9 years range | 26.279.7 years life expectancy |
| Stoke-on-TrentWest Midlands | 53.548.3 to 58.7 years range | 27.280.7 years life expectancy |
Find your area by region
Open your region or search for your area.
North East12 areas. 57.0 years in good health for men, 56.9 for women.
60.3 men, 60.7 women, highest in Newcastle upon Tyne. 52.1 men, 51.2 women, lowest in Hartlepool.
| Area | Men years in good health | Men years in poor health | Women years in good health | Women years in poor health |
|---|---|---|---|---|
| County Durham | 55.952.8 to 59.0 years rangeClearly below UK | 21.977.8 years life expectancy | 55.451.7 to 59.0 years rangeClearly below UK | 25.981.3 years life expectancy |
| Darlington | 58.655.5 to 61.7 years rangeNot clearly different | 19.177.7 years life expectancy | 58.655.3 to 61.9 years rangeNot clearly different | 22.981.5 years life expectancy |
| Gateshead | 58.054.9 to 61.2 years rangeNot clearly different | 18.976.9 years life expectancy | 58.454.4 to 62.3 years rangeNot clearly different | 23.181.5 years life expectancy |
| Hartlepool | 52.148.5 to 55.7 years rangeClearly below UK | 25.277.3 years life expectancy | 51.247.1 to 55.2 years rangeClearly below UK | 29.180.3 years life expectancy |
| Middlesbrough | 53.950.6 to 57.2 years rangeClearly below UK | 21.675.5 years life expectancy | 54.250.9 to 57.4 years rangeClearly below UK | 26.380.5 years life expectancy |
| Newcastle upon Tyne | 60.357.3 to 63.3 years rangeNot clearly different | 17.277.5 years life expectancy | 60.757.4 to 64.0 years rangeNot clearly different | 21.281.9 years life expectancy |
| North Tyneside | 57.653.9 to 61.4 years rangeNot clearly different | 20.678.2 years life expectancy | 57.453.5 to 61.2 years rangeNot clearly different | 24.682.0 years life expectancy |
| Northumberland | 59.856.9 to 62.6 years rangeNot clearly different | 19.379.1 years life expectancy | 59.956.8 to 62.9 years rangeNot clearly different | 23.383.2 years life expectancy |
| Redcar and Cleveland | 54.350.5 to 58.2 years rangeClearly below UK | 22.777.0 years life expectancy | 54.350.4 to 58.2 years rangeClearly below UK | 27.281.5 years life expectancy |
| South Tyneside | 55.952.6 to 59.1 years rangeClearly below UK | 20.976.8 years life expectancy | 55.852.4 to 59.2 years rangeClearly below UK | 25.281.0 years life expectancy |
| Stockton-on-Tees | 55.652.0 to 59.1 years rangeClearly below UK | 23.178.7 years life expectancy | 54.951.2 to 58.6 years rangeClearly below UK | 26.981.8 years life expectancy |
| Sunderland | 56.453.4 to 59.4 years rangeClearly below UK | 20.777.1 years life expectancy | 56.353.0 to 59.7 years rangeClearly below UK | 24.981.2 years life expectancy |
North West24 areas. 58.3 years in good health for men, 59.2 for women.
64.5 men, 66.0 women, highest in Cheshire East. 50.9 men, 51.8 women, lowest in Blackpool.
| Area | Men years in good health | Men years in poor health | Women years in good health | Women years in poor health |
|---|---|---|---|---|
| Blackburn with Darwen | 54.049.8 to 58.2 years rangeClearly below UK | 22.576.5 years life expectancy | 54.450.4 to 58.4 years rangeClearly below UK | 26.080.4 years life expectancy |
| Blackpool | 50.947.3 to 54.4 years rangeClearly below UK | 22.873.7 years life expectancy | 51.847.4 to 56.1 years rangeClearly below UK | 27.379.1 years life expectancy |
| Bolton | 54.650.1 to 59.2 years rangeClearly below UK | 22.376.9 years life expectancy | 55.350.0 to 60.6 years rangeClearly below UK | 26.181.4 years life expectancy |
| Bury | 57.453.1 to 61.6 years rangeNot clearly different | 20.778.1 years life expectancy | 58.254.1 to 62.3 years rangeNot clearly different | 23.882.0 years life expectancy |
| Cheshire East | 64.561.2 to 67.9 years rangeClearly above UK | 15.780.2 years life expectancy | 66.062.4 to 69.6 years rangeClearly above UK | 17.883.8 years life expectancy |
| Cheshire West and Chester | 61.657.5 to 65.6 years rangeNot clearly different | 18.079.6 years life expectancy | 62.958.2 to 67.6 years rangeNot clearly different | 20.883.7 years life expectancy |
| Cumberland | 59.055.7 to 62.4 years rangeNot clearly different | 18.877.8 years life expectancy | 60.156.0 to 64.2 years rangeNot clearly different | 21.681.7 years life expectancy |
| Halton | 56.452.1 to 60.6 years rangeClearly below UK | 20.977.3 years life expectancy | 56.852.4 to 61.2 years rangeNot clearly different | 24.080.8 years life expectancy |
| Knowsley | 54.049.4 to 58.6 years rangeClearly below UK | 23.277.2 years life expectancy | 53.748.7 to 58.7 years rangeClearly below UK | 26.680.3 years life expectancy |
| Lancashire | 59.357.3 to 61.4 years rangeNot clearly different | 19.178.4 years life expectancy | 60.358.0 to 62.6 years rangeNot clearly different | 21.982.2 years life expectancy |
| Liverpool | 55.852.2 to 59.4 years rangeClearly below UK | 20.376.1 years life expectancy | 56.753.2 to 60.2 years rangeClearly below UK | 23.680.3 years life expectancy |
| Manchester | 56.753.3 to 60.1 years rangeClearly below UK | 18.975.6 years life expectancy | 57.753.6 to 61.8 years rangeNot clearly different | 22.480.1 years life expectancy |
| Oldham | 56.152.2 to 60.1 years rangeClearly below UK | 21.277.3 years life expectancy | 56.752.9 to 60.5 years rangeClearly below UK | 24.681.3 years life expectancy |
| Rochdale | 53.850.1 to 57.5 years rangeClearly below UK | 23.577.3 years life expectancy | 54.250.0 to 58.3 years rangeClearly below UK | 27.181.3 years life expectancy |
| Salford | 57.252.5 to 61.9 years rangeNot clearly different | 19.576.7 years life expectancy | 58.253.2 to 63.2 years rangeNot clearly different | 22.780.9 years life expectancy |
| Sefton | 59.055.5 to 62.5 years rangeNot clearly different | 19.778.7 years life expectancy | 59.555.9 to 63.1 years rangeNot clearly different | 22.582.0 years life expectancy |
| St. Helens | 55.750.7 to 60.6 years rangeClearly below UK | 21.877.5 years life expectancy | 56.051.1 to 60.9 years rangeNot clearly different | 25.081.0 years life expectancy |
| Stockport | 61.858.3 to 65.3 years rangeNot clearly different | 17.779.5 years life expectancy | 63.159.5 to 66.8 years rangeNot clearly different | 20.383.4 years life expectancy |
| Tameside | 55.251.0 to 59.3 years rangeClearly below UK | 21.776.9 years life expectancy | 56.052.1 to 59.8 years rangeClearly below UK | 25.181.1 years life expectancy |
| Trafford | 63.860.4 to 67.1 years rangeNot clearly different | 16.079.8 years life expectancy | 65.261.3 to 69.1 years rangeClearly above UK | 18.583.7 years life expectancy |
| Warrington | 62.158.5 to 65.7 years rangeNot clearly different | 16.678.7 years life expectancy | 63.359.3 to 67.2 years rangeNot clearly different | 18.882.1 years life expectancy |
| Westmorland and Furness | 62.858.6 to 67.0 years rangeNot clearly different | 17.179.9 years life expectancy | 64.460.3 to 68.4 years rangeNot clearly different | 19.483.8 years life expectancy |
| Wigan | 54.650.3 to 58.9 years rangeClearly below UK | 22.877.4 years life expectancy | 55.150.1 to 60.1 years rangeClearly below UK | 26.281.3 years life expectancy |
| Wirral | 59.155.5 to 62.7 years rangeNot clearly different | 19.178.2 years life expectancy | 60.156.0 to 64.2 years rangeNot clearly different | 21.982.0 years life expectancy |
Yorkshire and the Humber15 areas. 58.2 years in good health for men, 58.6 for women.
64.5 men, 65.4 women, highest in North Yorkshire. 53.1 men, 53.3 women, lowest in City of Kingston upon Hull.
| Area | Men years in good health | Men years in poor health | Women years in good health | Women years in poor health |
|---|---|---|---|---|
| Barnsley | 55.251.6 to 58.8 years rangeClearly below UK | 22.077.2 years life expectancy | 55.351.4 to 59.2 years rangeClearly below UK | 25.881.1 years life expectancy |
| Bradford | 57.453.5 to 61.2 years rangeNot clearly different | 19.677.0 years life expectancy | 58.254.3 to 62.0 years rangeNot clearly different | 23.581.7 years life expectancy |
| Calderdale | 60.256.3 to 64.0 years rangeNot clearly different | 18.078.2 years life expectancy | 60.956.9 to 65.0 years rangeNot clearly different | 21.682.5 years life expectancy |
| City of Kingston upon Hull | 53.148.5 to 57.7 years rangeClearly below UK | 22.475.5 years life expectancy | 53.349.2 to 57.5 years rangeClearly below UK | 27.180.4 years life expectancy |
| Doncaster | 55.151.6 to 58.5 years rangeClearly below UK | 21.876.9 years life expectancy | 55.451.3 to 59.5 years rangeClearly below UK | 25.981.3 years life expectancy |
| East Riding of Yorkshire | 59.556.2 to 62.8 years rangeNot clearly different | 20.580.0 years life expectancy | 59.556.1 to 62.9 years rangeNot clearly different | 23.983.4 years life expectancy |
| Kirklees | 57.854.9 to 60.6 years rangeClearly below UK | 20.278.0 years life expectancy | 58.054.4 to 61.5 years rangeNot clearly different | 24.082.0 years life expectancy |
| Leeds | 60.457.9 to 62.9 years rangeNot clearly different | 18.478.8 years life expectancy | 60.958.0 to 63.8 years rangeNot clearly different | 21.782.6 years life expectancy |
| North East Lincolnshire | 54.750.6 to 58.9 years rangeClearly below UK | 22.176.8 years life expectancy | 54.951.1 to 58.7 years rangeClearly below UK | 26.281.1 years life expectancy |
| North Lincolnshire | 58.755.2 to 62.2 years rangeNot clearly different | 18.977.6 years life expectancy | 59.656.1 to 63.1 years rangeNot clearly different | 22.782.3 years life expectancy |
| North Yorkshire | 64.562.1 to 66.9 years rangeClearly above UK | 15.980.4 years life expectancy | 65.462.9 to 68.0 years rangeClearly above UK | 18.784.1 years life expectancy |
| Rotherham | 55.652.1 to 59.0 years rangeClearly below UK | 22.678.2 years life expectancy | 55.151.0 to 59.2 years rangeClearly below UK | 26.181.2 years life expectancy |
| Sheffield | 57.454.5 to 60.4 years rangeClearly below UK | 21.178.5 years life expectancy | 57.454.2 to 60.6 years rangeClearly below UK | 24.682.0 years life expectancy |
| Wakefield | 54.050.4 to 57.7 years rangeClearly below UK | 23.777.7 years life expectancy | 53.850.0 to 57.6 years rangeClearly below UK | 27.681.4 years life expectancy |
| York | 60.857.5 to 64.0 years rangeNot clearly different | 18.979.7 years life expectancy | 61.457.9 to 64.9 years rangeNot clearly different | 22.383.7 years life expectancy |
East Midlands10 areas. 59.4 years in good health for men, 59.3 for women.
65.0 men, 64.8 women, highest in Rutland. 55.6 men, 55.3 women, lowest in Nottingham.
| Area | Men years in good health | Men years in poor health | Women years in good health | Women years in poor health |
|---|---|---|---|---|
| Derby | 57.754.2 to 61.2 years rangeNot clearly different | 20.678.3 years life expectancy | 57.453.7 to 61.1 years rangeNot clearly different | 24.481.8 years life expectancy |
| Derbyshire | 60.558.1 to 63.0 years rangeNot clearly different | 18.779.2 years life expectancy | 60.557.5 to 63.5 years rangeNot clearly different | 22.282.7 years life expectancy |
| Leicester | 57.854.7 to 60.8 years rangeNot clearly different | 19.277.0 years life expectancy | 57.954.3 to 61.6 years rangeNot clearly different | 23.481.3 years life expectancy |
| Leicestershire | 61.558.9 to 64.1 years rangeNot clearly different | 19.080.5 years life expectancy | 61.458.6 to 64.2 years rangeNot clearly different | 22.684.0 years life expectancy |
| Lincolnshire | 58.655.9 to 61.4 years rangeNot clearly different | 20.178.7 years life expectancy | 58.655.4 to 61.7 years rangeNot clearly different | 24.182.7 years life expectancy |
| North Northamptonshire | 58.754.9 to 62.5 years rangeNot clearly different | 20.178.8 years life expectancy | 58.353.9 to 62.8 years rangeNot clearly different | 24.382.6 years life expectancy |
| Nottingham | 55.652.3 to 58.9 years rangeClearly below UK | 20.876.4 years life expectancy | 55.351.8 to 58.7 years rangeClearly below UK | 25.580.8 years life expectancy |
| Nottinghamshire | 58.956.5 to 61.2 years rangeNot clearly different | 20.279.1 years life expectancy | 58.755.7 to 61.7 years rangeNot clearly different | 24.583.2 years life expectancy |
| Rutland | 65.059.8 to 70.3 years rangeNot clearly different | 16.981.9 years life expectancy | 64.857.8 to 71.9 years rangeNot clearly different | 20.084.8 years life expectancy |
| West Northamptonshire | 61.658.0 to 65.3 years rangeNot clearly different | 18.079.6 years life expectancy | 61.958.1 to 65.7 years rangeNot clearly different | 21.783.6 years life expectancy |
West Midlands14 areas. 60.2 years in good health for men, 59.6 for women.
63.3 men, Warwickshire and Worcestershire joint highest; 63.1 women, Worcestershire highest. 52.7 men, 51.3 women, Sandwell lowest.
| Area | Men years in good health | Men years in poor health | Women years in good health | Women years in poor health |
|---|---|---|---|---|
| Birmingham | 58.356.2 to 60.4 years rangeClearly below UK | 18.877.1 years life expectancy | 58.055.5 to 60.5 years rangeClearly below UK | 23.881.8 years life expectancy |
| County of Herefordshire | 62.358.9 to 65.7 years rangeNot clearly different | 17.980.2 years life expectancy | 61.757.9 to 65.5 years rangeNot clearly different | 21.983.6 years life expectancy |
| Coventry | 59.255.9 to 62.6 years rangeNot clearly different | 18.277.4 years life expectancy | 58.955.3 to 62.5 years rangeNot clearly different | 22.981.8 years life expectancy |
| Dudley | 59.656.0 to 63.2 years rangeNot clearly different | 19.378.9 years life expectancy | 58.954.8 to 63.1 years rangeNot clearly different | 24.183.0 years life expectancy |
| Sandwell | 52.748.7 to 56.8 years rangeClearly below UK | 24.076.7 years life expectancy | 51.346.6 to 55.9 years rangeClearly below UK | 29.981.2 years life expectancy |
| Shropshire | 63.060.0 to 66.0 years rangeNot clearly different | 17.480.4 years life expectancy | 62.459.1 to 65.8 years rangeNot clearly different | 21.684.0 years life expectancy |
| Solihull | 63.260.2 to 66.2 years rangeNot clearly different | 17.080.2 years life expectancy | 62.959.8 to 66.0 years rangeNot clearly different | 21.484.3 years life expectancy |
| Staffordshire | 63.060.5 to 65.6 years rangeNot clearly different | 16.979.9 years life expectancy | 62.559.5 to 65.4 years rangeNot clearly different | 21.083.5 years life expectancy |
| Stoke-on-Trent | 55.151.0 to 59.2 years rangeClearly below UK | 22.077.1 years life expectancy | 53.548.3 to 58.7 years rangeClearly below UK | 27.280.7 years life expectancy |
| Telford and Wrekin | 56.752.8 to 60.6 years rangeClearly below UK | 21.678.3 years life expectancy | 55.450.8 to 60.1 years rangeClearly below UK | 26.882.2 years life expectancy |
| Walsall | 56.251.6 to 60.8 years rangeNot clearly different | 21.477.6 years life expectancy | 55.049.6 to 60.4 years rangeClearly below UK | 26.881.8 years life expectancy |
| Warwickshire | 63.360.8 to 65.8 years rangeClearly above UK | 16.679.9 years life expectancy | 62.960.0 to 65.8 years rangeNot clearly different | 20.783.6 years life expectancy |
| Wolverhampton | 59.254.6 to 63.8 years rangeNot clearly different | 17.977.1 years life expectancy | 58.654.1 to 63.1 years rangeNot clearly different | 22.681.2 years life expectancy |
| Worcestershire | 63.360.8 to 65.8 years rangeClearly above UK | 16.579.8 years life expectancy | 63.160.1 to 66.2 years rangeNot clearly different | 20.783.8 years life expectancy |
East of England11 areas. 62.3 years in good health for men, 62.0 for women.
65.4 men, 65.5 women, highest in Hertfordshire. 56.9 men, 55.8 women, lowest in Luton.
| Area | Men years in good health | Men years in poor health | Women years in good health | Women years in poor health |
|---|---|---|---|---|
| Bedford | 62.557.7 to 67.3 years rangeNot clearly different | 17.179.6 years life expectancy | 62.756.9 to 68.5 years rangeNot clearly different | 21.283.9 years life expectancy |
| Cambridgeshire | 62.359.7 to 64.8 years rangeNot clearly different | 18.781.0 years life expectancy | 61.558.4 to 64.5 years rangeNot clearly different | 22.784.2 years life expectancy |
| Central Bedfordshire | 61.557.5 to 65.5 years rangeNot clearly different | 19.180.6 years life expectancy | 60.956.2 to 65.5 years rangeNot clearly different | 23.384.2 years life expectancy |
| Essex | 62.760.7 to 64.8 years rangeNot clearly different | 17.780.4 years life expectancy | 62.460.1 to 64.7 years rangeNot clearly different | 21.684.0 years life expectancy |
| Hertfordshire | 65.463.2 to 67.6 years rangeClearly above UK | 15.781.1 years life expectancy | 65.562.9 to 68.1 years rangeClearly above UK | 19.284.7 years life expectancy |
| Luton | 56.953.2 to 60.7 years rangeNot clearly different | 21.778.6 years life expectancy | 55.851.5 to 60.0 years rangeClearly below UK | 26.882.6 years life expectancy |
| Norfolk | 61.358.8 to 63.8 years rangeNot clearly different | 18.579.8 years life expectancy | 61.158.3 to 63.8 years rangeNot clearly different | 22.583.6 years life expectancy |
| Peterborough | 58.054.0 to 61.9 years rangeNot clearly different | 20.178.1 years life expectancy | 57.453.0 to 61.9 years rangeNot clearly different | 24.581.9 years life expectancy |
| Southend-on-Sea | 61.358.1 to 64.6 years rangeNot clearly different | 17.478.7 years life expectancy | 61.457.0 to 65.8 years rangeNot clearly different | 21.582.9 years life expectancy |
| Suffolk | 62.159.5 to 64.6 years rangeNot clearly different | 18.580.6 years life expectancy | 61.758.6 to 64.7 years rangeNot clearly different | 22.584.2 years life expectancy |
| Thurrock | 58.955.5 to 62.3 years rangeNot clearly different | 20.078.9 years life expectancy | 58.254.0 to 62.3 years rangeNot clearly different | 24.582.7 years life expectancy |
London32 areas. 62.9 years in good health for men, 62.9 for women.
69.3 men, 70.3 women, Richmond upon Thames highest. 58.3 men, Haringey and Lewisham joint lowest; 57.5 women, Greenwich lowest.
| Area | Men years in good health | Men years in poor health | Women years in good health | Women years in poor health |
|---|---|---|---|---|
| Barking and Dagenham | 59.655.2 to 64.1 years rangeNot clearly different | 18.778.3 years life expectancy | 59.054.0 to 64.0 years rangeNot clearly different | 22.781.7 years life expectancy |
| Barnet | 62.758.5 to 67.0 years rangeNot clearly different | 19.882.5 years life expectancy | 61.757.2 to 66.2 years rangeNot clearly different | 24.285.9 years life expectancy |
| Bexley | 61.957.5 to 66.2 years rangeNot clearly different | 18.480.3 years life expectancy | 61.156.3 to 65.8 years rangeNot clearly different | 22.483.5 years life expectancy |
| Brent | 64.559.4 to 69.6 years rangeNot clearly different | 15.580.0 years life expectancy | 65.259.6 to 70.9 years rangeNot clearly different | 20.385.5 years life expectancy |
| Bromley | 67.564.4 to 70.6 years rangeClearly above UK | 14.481.9 years life expectancy | 67.764.0 to 71.4 years rangeClearly above UK | 18.085.7 years life expectancy |
| Camden | 59.854.8 to 64.8 years rangeNot clearly different | 20.980.7 years life expectancy | 59.454.0 to 64.7 years rangeNot clearly different | 26.585.9 years life expectancy |
| Croydon | 66.763.0 to 70.3 years rangeClearly above UK | 13.279.9 years life expectancy | 67.563.8 to 71.1 years rangeClearly above UK | 16.884.3 years life expectancy |
| Ealing | 62.656.5 to 68.7 years rangeNot clearly different | 18.080.6 years life expectancy | 62.855.7 to 69.8 years rangeNot clearly different | 22.685.4 years life expectancy |
| Enfield | 61.156.4 to 65.8 years rangeNot clearly different | 20.181.2 years life expectancy | 60.854.1 to 67.6 years rangeNot clearly different | 24.385.1 years life expectancy |
| Greenwich | 58.553.8 to 63.2 years rangeNot clearly different | 20.979.4 years life expectancy | 57.549.8 to 65.1 years rangeNot clearly different | 25.482.9 years life expectancy |
| Hackney | 59.353.8 to 64.7 years rangeNot clearly different | 19.078.3 years life expectancy | 58.952.7 to 65.0 years rangeNot clearly different | 24.082.9 years life expectancy |
| Hammersmith and Fulham | 66.261.5 to 71.0 years rangeClearly above UK | 13.880.0 years life expectancy | 67.161.7 to 72.5 years rangeClearly above UK | 17.584.6 years life expectancy |
| Haringey | 58.353.3 to 63.3 years rangeNot clearly different | 21.780.0 years life expectancy | 58.253.3 to 63.0 years rangeNot clearly different | 27.385.5 years life expectancy |
| Harrow | 62.957.2 to 68.6 years rangeNot clearly different | 19.081.9 years life expectancy | 62.757.3 to 68.1 years rangeNot clearly different | 23.185.8 years life expectancy |
| Havering | 63.860.1 to 67.5 years rangeNot clearly different | 16.780.5 years life expectancy | 63.358.4 to 68.2 years rangeNot clearly different | 20.784.0 years life expectancy |
| Hillingdon | 64.459.7 to 69.1 years rangeNot clearly different | 15.680.0 years life expectancy | 64.759.1 to 70.3 years rangeNot clearly different | 19.884.5 years life expectancy |
| Hounslow | 59.652.3 to 66.8 years rangeNot clearly different | 20.780.3 years life expectancy | 59.450.9 to 68.0 years rangeNot clearly different | 25.384.7 years life expectancy |
| Islington | 60.555.9 to 65.1 years rangeNot clearly different | 18.278.7 years life expectancy | 60.554.5 to 66.6 years rangeNot clearly different | 23.283.7 years life expectancy |
| Kensington and Chelsea | 66.562.2 to 70.8 years rangeClearly above UK | 15.782.2 years life expectancy | 66.861.6 to 72.1 years rangeClearly above UK | 20.387.1 years life expectancy |
| Kingston upon Thames | 66.962.3 to 71.4 years rangeClearly above UK | 15.182.0 years life expectancy | 67.062.1 to 71.9 years rangeClearly above UK | 18.485.4 years life expectancy |
| Lambeth | 63.758.3 to 69.1 years rangeNot clearly different | 15.278.9 years life expectancy | 64.657.6 to 71.7 years rangeNot clearly different | 19.283.8 years life expectancy |
| Lewisham | 58.352.0 to 64.7 years rangeNot clearly different | 20.678.9 years life expectancy | 58.152.3 to 63.9 years rangeNot clearly different | 25.583.6 years life expectancy |
| Merton | 62.457.3 to 67.5 years rangeNot clearly different | 18.580.9 years life expectancy | 61.956.0 to 67.8 years rangeNot clearly different | 23.185.0 years life expectancy |
| Newham | 62.857.7 to 67.8 years rangeNot clearly different | 16.479.2 years life expectancy | 63.156.9 to 69.4 years rangeNot clearly different | 20.583.6 years life expectancy |
| Redbridge | 63.558.8 to 68.1 years rangeNot clearly different | 17.480.9 years life expectancy | 63.358.7 to 68.0 years rangeNot clearly different | 21.785.0 years life expectancy |
| Richmond upon Thames | 69.365.2 to 73.5 years rangeClearly above UK | 13.482.7 years life expectancy | 70.365.2 to 75.4 years rangeClearly above UK | 16.586.8 years life expectancy |
| Southwark | 62.655.2 to 70.0 years rangeNot clearly different | 16.879.4 years life expectancy | 62.756.8 to 68.5 years rangeNot clearly different | 21.083.7 years life expectancy |
| Sutton | 68.364.4 to 72.2 years rangeClearly above UK | 12.680.9 years life expectancy | 68.764.5 to 72.9 years rangeClearly above UK | 15.884.5 years life expectancy |
| Tower Hamlets | 59.553.2 to 65.9 years rangeNot clearly different | 19.278.7 years life expectancy | 59.253.0 to 65.3 years rangeNot clearly different | 23.782.9 years life expectancy |
| Waltham Forest | 64.459.9 to 68.9 years rangeNot clearly different | 15.479.8 years life expectancy | 64.559.8 to 69.2 years rangeNot clearly different | 19.584.0 years life expectancy |
| Wandsworth | 63.857.4 to 70.1 years rangeNot clearly different | 16.880.6 years life expectancy | 63.855.2 to 72.4 years rangeNot clearly different | 21.385.1 years life expectancy |
| Westminster | 60.554.1 to 66.8 years rangeNot clearly different | 21.481.9 years life expectancy | 59.852.5 to 67.1 years rangeNot clearly different | 26.686.4 years life expectancy |
South East19 areas. 63.0 years in good health for men, 64.3 for women.
68.0 men, 69.4 women, highest in Wokingham. 57.5 men, 58.6 women, lowest in Portsmouth.
| Area | Men years in good health | Men years in poor health | Women years in good health | Women years in poor health |
|---|---|---|---|---|
| Bracknell Forest | 65.262.1 to 68.2 years rangeClearly above UK | 16.081.2 years life expectancy | 67.063.6 to 70.4 years rangeClearly above UK | 18.285.2 years life expectancy |
| Brighton and Hove | 61.157.4 to 64.8 years rangeNot clearly different | 18.379.4 years life expectancy | 62.657.9 to 67.2 years rangeNot clearly different | 21.083.6 years life expectancy |
| Buckinghamshire | 65.362.8 to 67.8 years rangeClearly above UK | 16.281.5 years life expectancy | 66.964.1 to 69.7 years rangeClearly above UK | 18.685.5 years life expectancy |
| East Sussex | 59.256.2 to 62.1 years rangeNot clearly different | 21.080.2 years life expectancy | 59.956.2 to 63.6 years rangeNot clearly different | 23.983.8 years life expectancy |
| Hampshire | 64.262.3 to 66.0 years rangeClearly above UK | 17.381.5 years life expectancy | 65.163.0 to 67.3 years rangeClearly above UK | 19.784.8 years life expectancy |
| Isle of Wight | 58.654.9 to 62.3 years rangeNot clearly different | 21.980.5 years life expectancy | 59.354.7 to 63.9 years rangeNot clearly different | 24.784.0 years life expectancy |
| Kent | 62.560.7 to 64.3 years rangeNot clearly different | 17.279.7 years life expectancy | 63.961.9 to 65.9 years rangeClearly above UK | 19.883.7 years life expectancy |
| Medway | 59.055.5 to 62.5 years rangeNot clearly different | 19.778.7 years life expectancy | 60.255.9 to 64.5 years rangeNot clearly different | 22.482.6 years life expectancy |
| Milton Keynes | 60.857.7 to 63.8 years rangeNot clearly different | 19.480.2 years life expectancy | 61.558.0 to 64.9 years rangeNot clearly different | 21.583.0 years life expectancy |
| Oxfordshire | 65.462.7 to 68.0 years rangeClearly above UK | 16.281.6 years life expectancy | 66.663.5 to 69.8 years rangeClearly above UK | 18.585.1 years life expectancy |
| Portsmouth | 57.553.6 to 61.4 years rangeNot clearly different | 20.678.1 years life expectancy | 58.654.2 to 63.0 years rangeNot clearly different | 24.082.6 years life expectancy |
| Reading | 61.757.4 to 66.0 years rangeNot clearly different | 17.779.4 years life expectancy | 63.058.4 to 67.6 years rangeNot clearly different | 20.383.3 years life expectancy |
| Slough | 60.156.3 to 63.9 years rangeNot clearly different | 17.877.9 years life expectancy | 61.856.2 to 67.3 years rangeNot clearly different | 20.882.6 years life expectancy |
| Southampton | 57.653.8 to 61.5 years rangeNot clearly different | 20.478.0 years life expectancy | 59.055.0 to 63.0 years rangeNot clearly different | 23.682.6 years life expectancy |
| Surrey | 65.163.0 to 67.2 years rangeClearly above UK | 16.781.8 years life expectancy | 66.463.8 to 68.9 years rangeClearly above UK | 18.985.3 years life expectancy |
| West Berkshire | 65.561.6 to 69.3 years rangeClearly above UK | 16.281.7 years life expectancy | 66.562.7 to 70.4 years rangeClearly above UK | 18.284.7 years life expectancy |
| West Sussex | 63.160.4 to 65.7 years rangeNot clearly different | 17.580.6 years life expectancy | 64.561.6 to 67.4 years rangeClearly above UK | 20.084.5 years life expectancy |
| Windsor and Maidenhead | 67.364.8 to 69.8 years rangeClearly above UK | 14.581.8 years life expectancy | 68.965.4 to 72.4 years rangeClearly above UK | 16.585.4 years life expectancy |
| Wokingham | 68.065.1 to 71.0 years rangeClearly above UK | 14.882.8 years life expectancy | 69.466.0 to 72.9 years rangeClearly above UK | 16.485.8 years life expectancy |
South West14 areas. 62.4 years in good health for men, 62.4 for women.
65.3 men, 65.6 women, Dorset and Bath and North East Somerset joint highest. 55.2 men, 54.0 women, Plymouth lowest.
| Area | Men years in good health | Men years in poor health | Women years in good health | Women years in poor health |
|---|---|---|---|---|
| Bath and North East Somerset | 65.362.1 to 68.5 years rangeClearly above UK | 16.181.4 years life expectancy | 65.662.3 to 68.9 years rangeClearly above UK | 19.384.9 years life expectancy |
| Bournemouth, Christchurch and Poole | 61.459.1 to 63.8 years rangeNot clearly different | 18.379.7 years life expectancy | 61.558.8 to 64.2 years rangeNot clearly different | 22.483.9 years life expectancy |
| City of Bristol | 60.157.1 to 63.2 years rangeNot clearly different | 18.478.5 years life expectancy | 60.156.3 to 63.9 years rangeNot clearly different | 22.983.0 years life expectancy |
| Cornwall | 60.257.0 to 63.3 years rangeNot clearly different | 19.379.5 years life expectancy | 60.056.5 to 63.5 years rangeNot clearly different | 23.683.6 years life expectancy |
| Devon | 63.761.6 to 65.9 years rangeClearly above UK | 16.980.6 years life expectancy | 64.061.4 to 66.5 years rangeClearly above UK | 20.684.6 years life expectancy |
| Dorset | 65.362.5 to 68.1 years rangeClearly above UK | 15.881.1 years life expectancy | 65.662.1 to 69.1 years rangeClearly above UK | 19.284.8 years life expectancy |
| Gloucestershire | 63.460.8 to 65.9 years rangeClearly above UK | 16.980.3 years life expectancy | 63.460.4 to 66.4 years rangeNot clearly different | 20.583.9 years life expectancy |
| North Somerset | 62.659.7 to 65.4 years rangeNot clearly different | 18.280.8 years life expectancy | 62.458.8 to 65.9 years rangeNot clearly different | 21.884.2 years life expectancy |
| Plymouth | 55.251.3 to 59.2 years rangeClearly below UK | 23.478.6 years life expectancy | 54.049.7 to 58.3 years rangeClearly below UK | 28.682.6 years life expectancy |
| Somerset | 62.860.2 to 65.3 years rangeNot clearly different | 17.480.2 years life expectancy | 63.059.6 to 66.3 years rangeNot clearly different | 21.184.1 years life expectancy |
| South Gloucestershire | 64.261.0 to 67.4 years rangeClearly above UK | 16.881.0 years life expectancy | 64.060.8 to 67.3 years rangeNot clearly different | 20.784.7 years life expectancy |
| Swindon | 61.558.0 to 64.9 years rangeNot clearly different | 18.479.9 years life expectancy | 61.457.4 to 65.4 years rangeNot clearly different | 22.383.7 years life expectancy |
| Torbay | 61.558.3 to 64.7 years rangeNot clearly different | 17.178.6 years life expectancy | 61.958.2 to 65.6 years rangeNot clearly different | 21.383.2 years life expectancy |
| Wiltshire | 63.861.0 to 66.5 years rangeClearly above UK | 17.581.3 years life expectancy | 63.760.5 to 66.9 years rangeNot clearly different | 21.084.7 years life expectancy |
Wales22 areas. 59.2 years in good health for men, 58.5 for women.
64.2 men, 63.8 women, highest in Powys. 51.7 men, 50.1 women, lowest in Merthyr Tydfil.
| Area | Men years in good health | Men years in poor health | Women years in good health | Women years in poor health |
|---|---|---|---|---|
| Blaenau Gwent | 55.750.7 to 60.8 years rangeNot clearly different | 20.175.8 years life expectancy | 54.449.3 to 59.6 years rangeClearly below UK | 24.879.2 years life expectancy |
| Bridgend | 57.954.0 to 61.8 years rangeNot clearly different | 20.278.1 years life expectancy | 57.252.4 to 62.0 years rangeNot clearly different | 24.781.9 years life expectancy |
| Caerphilly | 58.054.8 to 61.2 years rangeNot clearly different | 19.277.2 years life expectancy | 56.953.3 to 60.5 years rangeClearly below UK | 23.780.6 years life expectancy |
| Cardiff | 60.156.3 to 63.9 years rangeNot clearly different | 18.478.5 years life expectancy | 59.555.3 to 63.7 years rangeNot clearly different | 22.782.2 years life expectancy |
| Carmarthenshire | 57.754.6 to 60.9 years rangeNot clearly different | 21.078.7 years life expectancy | 56.252.1 to 60.4 years rangeClearly below UK | 25.781.9 years life expectancy |
| Ceredigion | 63.359.2 to 67.4 years rangeNot clearly different | 16.479.7 years life expectancy | 63.258.3 to 68.0 years rangeNot clearly different | 20.183.3 years life expectancy |
| Conwy | 61.157.6 to 64.5 years rangeNot clearly different | 17.878.9 years life expectancy | 60.755.9 to 65.5 years rangeNot clearly different | 21.982.6 years life expectancy |
| Denbighshire | 59.956.8 to 63.1 years rangeNot clearly different | 17.877.7 years life expectancy | 59.255.2 to 63.2 years rangeNot clearly different | 22.081.2 years life expectancy |
| Flintshire | 59.155.3 to 62.8 years rangeNot clearly different | 19.778.8 years life expectancy | 58.253.7 to 62.6 years rangeNot clearly different | 24.282.4 years life expectancy |
| Gwynedd | 62.358.6 to 66.1 years rangeNot clearly different | 16.578.8 years life expectancy | 62.558.4 to 66.5 years rangeNot clearly different | 20.883.3 years life expectancy |
| Isle of Anglesey | 61.258.0 to 64.4 years rangeNot clearly different | 17.578.7 years life expectancy | 61.157.4 to 64.9 years rangeNot clearly different | 21.682.7 years life expectancy |
| Merthyr Tydfil | 51.747.1 to 56.3 years rangeClearly below UK | 23.375.0 years life expectancy | 50.144.7 to 55.4 years rangeClearly below UK | 29.679.7 years life expectancy |
| Monmouthshire | 63.259.9 to 66.5 years rangeNot clearly different | 17.180.3 years life expectancy | 63.558.9 to 68.1 years rangeNot clearly different | 21.184.6 years life expectancy |
| Neath Port Talbot | 57.854.2 to 61.3 years rangeNot clearly different | 19.777.5 years life expectancy | 57.153.4 to 60.8 years rangeClearly below UK | 24.381.4 years life expectancy |
| Newport | 57.153.4 to 60.8 years rangeNot clearly different | 20.877.9 years life expectancy | 56.152.0 to 60.1 years rangeClearly below UK | 26.082.1 years life expectancy |
| Pembrokeshire | 61.658.1 to 65.1 years rangeNot clearly different | 17.278.8 years life expectancy | 61.557.5 to 65.5 years rangeNot clearly different | 21.683.1 years life expectancy |
| Powys | 64.260.3 to 68.1 years rangeNot clearly different | 16.180.3 years life expectancy | 63.859.1 to 68.4 years rangeNot clearly different | 19.883.6 years life expectancy |
| Rhondda Cynon Taf | 56.052.2 to 59.8 years rangeClearly below UK | 21.077.0 years life expectancy | 54.951.5 to 58.3 years rangeClearly below UK | 26.481.3 years life expectancy |
| Swansea | 57.454.2 to 60.6 years rangeClearly below UK | 20.177.5 years life expectancy | 56.853.1 to 60.5 years rangeClearly below UK | 25.482.2 years life expectancy |
| Torfaen | 54.150.0 to 58.2 years rangeClearly below UK | 23.577.6 years life expectancy | 52.848.4 to 57.3 years rangeClearly below UK | 28.881.6 years life expectancy |
| Vale of Glamorgan | 62.759.0 to 66.3 years rangeNot clearly different | 17.680.3 years life expectancy | 62.358.5 to 66.2 years rangeNot clearly different | 21.683.9 years life expectancy |
| Wrexham | 60.356.7 to 63.9 years rangeNot clearly different | 17.277.5 years life expectancy | 60.155.7 to 64.5 years rangeNot clearly different | 22.082.1 years life expectancy |
Scotland32 areas. 59.1 years in good health for men, 59.4 for women.
67.9 men, 68.7 women, highest in East Renfrewshire. 52.9 men, 52.3 women, lowest in North Lanarkshire.
| Area | Men years in good health | Men years in poor health | Women years in good health | Women years in poor health |
|---|---|---|---|---|
| Aberdeen City | 58.855.0 to 62.6 years rangeNot clearly different | 18.577.3 years life expectancy | 59.054.8 to 63.3 years rangeNot clearly different | 22.381.3 years life expectancy |
| Aberdeenshire | 64.159.9 to 68.3 years rangeNot clearly different | 15.479.5 years life expectancy | 64.760.6 to 68.7 years rangeNot clearly different | 18.282.9 years life expectancy |
| Angus | 62.258.7 to 65.8 years rangeNot clearly different | 15.978.1 years life expectancy | 62.958.7 to 67.2 years rangeNot clearly different | 18.881.7 years life expectancy |
| Argyll and Bute | 58.854.2 to 63.4 years rangeNot clearly different | 19.378.1 years life expectancy | 58.953.0 to 64.8 years rangeNot clearly different | 23.081.9 years life expectancy |
| City of Edinburgh | 63.260.1 to 66.2 years rangeNot clearly different | 15.178.3 years life expectancy | 63.960.8 to 67.1 years rangeNot clearly different | 18.382.2 years life expectancy |
| Clackmannanshire | 54.849.6 to 60.0 years rangeClearly below UK | 21.175.9 years life expectancy | 54.949.5 to 60.2 years rangeClearly below UK | 25.480.3 years life expectancy |
| Dumfries and Galloway | 58.854.7 to 62.9 years rangeNot clearly different | 18.477.2 years life expectancy | 59.152.6 to 65.5 years rangeNot clearly different | 22.181.2 years life expectancy |
| Dundee City | 55.952.0 to 59.7 years rangeClearly below UK | 19.475.3 years life expectancy | 55.751.3 to 60.0 years rangeClearly below UK | 23.979.6 years life expectancy |
| East Ayrshire | 54.249.6 to 58.8 years rangeClearly below UK | 21.575.7 years life expectancy | 53.548.1 to 58.9 years rangeClearly below UK | 25.478.9 years life expectancy |
| East Dunbartonshire | 63.960.8 to 67.0 years rangeClearly above UK | 16.480.3 years life expectancy | 64.660.7 to 68.5 years rangeNot clearly different | 19.684.2 years life expectancy |
| East Lothian | 60.256.0 to 64.4 years rangeNot clearly different | 18.578.7 years life expectancy | 60.455.9 to 64.9 years rangeNot clearly different | 22.282.6 years life expectancy |
| East Renfrewshire | 67.964.0 to 71.8 years rangeClearly above UK | 13.681.5 years life expectancy | 68.764.3 to 73.0 years rangeClearly above UK | 16.284.9 years life expectancy |
| Falkirk | 58.855.3 to 62.4 years rangeNot clearly different | 17.576.3 years life expectancy | 59.255.5 to 62.8 years rangeNot clearly different | 20.880.0 years life expectancy |
| Fife | 58.956.0 to 61.7 years rangeNot clearly different | 18.477.3 years life expectancy | 59.055.4 to 62.7 years rangeNot clearly different | 21.980.9 years life expectancy |
| Glasgow City | 55.752.1 to 59.2 years rangeClearly below UK | 18.674.3 years life expectancy | 56.152.4 to 59.7 years rangeClearly below UK | 22.678.7 years life expectancy |
| Highland | 61.055.7 to 66.3 years rangeNot clearly different | 16.777.7 years life expectancy | 62.055.2 to 68.7 years rangeNot clearly different | 20.082.0 years life expectancy |
| Inverclyde | 54.149.7 to 58.6 years rangeClearly below UK | 21.575.6 years life expectancy | 53.648.3 to 59.0 years rangeClearly below UK | 26.079.6 years life expectancy |
| Midlothian | 60.355.0 to 65.6 years rangeNot clearly different | 17.577.8 years life expectancy | 60.954.6 to 67.2 years rangeNot clearly different | 21.182.0 years life expectancy |
| Moray | 61.357.3 to 65.4 years rangeNot clearly different | 16.477.7 years life expectancy | 62.557.6 to 67.4 years rangeNot clearly different | 19.782.2 years life expectancy |
| Na h-Eileanan Siar | 63.454.7 to 72.2 years rangeNot clearly different | 13.476.8 years life expectancy | 64.551.0 to 77.9 years rangeNot clearly different | 16.380.8 years life expectancy |
| North Ayrshire | 53.348.5 to 58.0 years rangeClearly below UK | 21.775.0 years life expectancy | 53.548.1 to 58.9 years rangeClearly below UK | 26.279.7 years life expectancy |
| North Lanarkshire | 52.948.5 to 57.2 years rangeClearly below UK | 22.375.2 years life expectancy | 52.348.0 to 56.5 years rangeClearly below UK | 26.678.9 years life expectancy |
| Orkney Islands | 72.963.8 to 82.1 years rangeClearly above UK Very uncertain figure | 6.479.3 years life expectancy | 74.163.2 to 85.0 years rangeClearly above UK Very uncertain figure | 8.782.8 years life expectancy |
| Perth and Kinross | 65.362.0 to 68.7 years rangeClearly above UK | 13.879.1 years life expectancy | 66.462.7 to 70.0 years rangeClearly above UK | 16.482.8 years life expectancy |
| Renfrewshire | 56.552.4 to 60.7 years rangeNot clearly different | 20.076.5 years life expectancy | 56.551.6 to 61.4 years rangeNot clearly different | 24.480.9 years life expectancy |
| Scottish Borders | 62.358.6 to 66.0 years rangeNot clearly different | 16.779.0 years life expectancy | 63.058.6 to 67.5 years rangeNot clearly different | 19.782.7 years life expectancy |
| Shetland Islands | 68.358.0 to 78.7 years rangeNot clearly different Very uncertain figure | 11.279.5 years life expectancy | 70.858.8 to 82.8 years rangeNot clearly different Very uncertain figure | 13.183.9 years life expectancy |
| South Ayrshire | 57.552.6 to 62.5 years rangeNot clearly different | 19.376.8 years life expectancy | 58.053.0 to 63.1 years rangeNot clearly different | 23.381.3 years life expectancy |
| South Lanarkshire | 58.154.6 to 61.5 years rangeNot clearly different | 18.776.8 years life expectancy | 57.853.8 to 61.8 years rangeNot clearly different | 22.780.5 years life expectancy |
| Stirling | 60.256.9 to 63.6 years rangeNot clearly different | 18.378.5 years life expectancy | 60.356.4 to 64.3 years rangeNot clearly different | 21.982.2 years life expectancy |
| West Dunbartonshire | 53.249.5 to 56.9 years rangeClearly below UK | 21.875.0 years life expectancy | 53.048.6 to 57.3 years rangeClearly below UK | 26.779.7 years life expectancy |
| West Lothian | 60.056.6 to 63.5 years rangeNot clearly different | 17.377.3 years life expectancy | 60.356.3 to 64.3 years rangeNot clearly different | 20.580.8 years life expectancy |
Northern Ireland11 areas. 60.8 years in good health for men, 60.7 for women.
65.5 men, highest in Lisburn and Castlereagh; 65.9 women, highest in Mid Ulster. 54.9 men, 54.2 women, lowest in Derry City and Strabane.
| Area | Men years in good health | Men years in poor health | Women years in good health | Women years in poor health |
|---|---|---|---|---|
| Antrim and Newtownabbey | 62.659.5 to 65.8 years rangeNot clearly different | 16.779.3 years life expectancy | 62.659.3 to 65.8 years rangeNot clearly different | 19.982.5 years life expectancy |
| Ards and North Down | 61.959.3 to 64.6 years rangeNot clearly different | 18.079.9 years life expectancy | 61.858.9 to 64.6 years rangeNot clearly different | 21.783.5 years life expectancy |
| Armagh City, Banbridge and Craigavon | 61.258.6 to 63.9 years rangeNot clearly different | 17.879.0 years life expectancy | 61.458.6 to 64.2 years rangeNot clearly different | 21.883.2 years life expectancy |
| Belfast | 56.954.7 to 59.0 years rangeClearly below UK | 19.676.5 years life expectancy | 56.654.2 to 59.1 years rangeClearly below UK | 23.980.5 years life expectancy |
| Causeway Coast and Glens | 58.855.0 to 62.5 years rangeNot clearly different | 20.379.1 years life expectancy | 58.354.5 to 62.1 years rangeNot clearly different | 24.983.2 years life expectancy |
| Derry City and Strabane | 54.951.2 to 58.6 years rangeClearly below UK | 22.777.6 years life expectancy | 54.250.2 to 58.2 years rangeClearly below UK | 27.081.2 years life expectancy |
| Fermanagh and Omagh | 62.159.1 to 65.1 years rangeNot clearly different | 17.779.8 years life expectancy | 62.158.5 to 65.7 years rangeNot clearly different | 21.783.8 years life expectancy |
| Lisburn and Castlereagh | 65.562.9 to 68.0 years rangeClearly above UK | 15.080.5 years life expectancy | 65.862.7 to 68.8 years rangeClearly above UK | 18.083.8 years life expectancy |
| Mid and East Antrim | 60.557.6 to 63.4 years rangeNot clearly different | 18.378.8 years life expectancy | 60.557.2 to 63.7 years rangeNot clearly different | 22.683.1 years life expectancy |
| Mid Ulster | 65.462.7 to 68.0 years rangeClearly above UK | 14.179.5 years life expectancy | 65.963.1 to 68.8 years rangeClearly above UK | 17.583.4 years life expectancy |
| Newry, Mourne and Down | 63.260.5 to 65.9 years rangeNot clearly different | 16.279.4 years life expectancy | 63.360.6 to 65.9 years rangeNot clearly different | 19.983.2 years life expectancy |
Method and sources
Understanding the figures
2022 to 2024 figures come from matching ONS releases. Healthy life expectancy, UK, was published on 19 February 2026. Life expectancy for local areas of the UK was published on 10 December 2025. Both combine data across these years.
Good health means people say their general health is good or very good. We calculate years in poor health as life expectancy less years in good health.
79.2 less 60.7 = 18.5 (UK men, years in poor health)
83.0 less 60.9 = 22.1 (UK women, years in poor health)
95% confidence intervals give the range. We label an area clearly above or below the UK when its whole range sits above or below the UK figure. Otherwise, we label it not clearly different.
10 areas feature in each top and bottom list, with uncertain order. Overlapping ranges prevent full rankings. All listed areas are clearly above or below the UK respectively. The women’s bottom list includes ties. Very uncertain Orkney and Shetland figures are excluded from top lists.
79.1 years for UK men and 83.0 for women appear in the ONS national life tables. Those use a different method. We use UK and nation life expectancy from the local areas release, matching the figures used for healthy life expectancy.
How your search works
August 2026 ONS lookup uses live residential postcodes. Districts (ME14) and sectors (ME14 1) use the area containing most postcodes. If 1% or more lie elsewhere, you’re told most are in the matched area.
April 2024 ONS built up areas match towns in England and Wales to areas holding most output areas. Scottish and Northern Irish towns use postcode districts. District councils use the April 2025 ONS county lookup.
December 2025 ONS county and unitary authority boundaries are simplified for the map. London is enlarged in a box; Shetland is moved into a box. Area boundaries are as at August 2025.
Things to bear in mind
- 2022 to 2024 babies’ life expectancy assumes unchanged death rates. Area averages cannot forecast your lifespan.
- Official statistics in development use a new interim method because fewer people answer the survey.
- 47.3 to 54.4 is Blackpool men’s range. Local ranges are wide; calculated years in poor health are equally uncertain.
- 2022 to 2024 combines data across years, including pandemic effects on deaths in 2022.
- Northern Ireland’s ONS figures use different methods from its Department of Health figures.
Your privacy
The tool works in your browser, and nothing you type is saved or sent.
Sources
- 19 February 2026 ONS healthy life expectancy release and dataset
- 10 December 2025 ONS life expectancy for local areas release and dataset
- ONS healthy life expectancy quality and methods guide
- August 2026 ONS postcode lookup
- April 2024 ONS built up areas lookup
- ONS area boundaries and district lookups on the Open Geography Portal
- 2022 to 2024 ONS national life tables, published 10 December 2025
Built by Paul Gillooly, Founder, PJG Financial. Last checked 18 November 2026. We’ll check it again when the ONS publishes new healthy life expectancy figures.
For press and data enquiries, email press@lifeadviser.co.uk.
You can use and quote these figures with a credit and a link to this page.
This is general information, not financial advice, and figures are averages for an area, not a forecast for you.
For journalists
Use these figures and the map free with a LifeAdviser credit and link.